
Waste Data Dashboard for Sustainability Reporting
Helping B2B customers see where their waste goes, and turning a compliance report into a premium insight tool.
Project Overview

At Stena Recycling I helped evolve a one-off CSRD report download into a premium, interactive dashboard that shows where a company’s waste goes, how circular it is, and what to improve — from concept and customer interviews to pixel-perfect UI built in the test environment.
Responsibility: Concept exploration, 4 customer interviews, value prioritisation, MVP scoping, daily design–dev sync
Keywords: UX/UI Design · Data Visualization · Dashboard · B2B SaaS · Sustainability
Timeline: Jan – Aug 2026; premium offer targeted for launch end of September 2026
Context
The EU’s Corporate Sustainability Reporting Directive (CSRD) requires large companies to report on their environmental impact using the European Sustainability Reporting Standards (ESRS). ESRS E5 covers resource use and the circular economy — including how much waste a company produces, how much is hazardous, and how much is diverted from disposal (reused, recycled, recovered) versus sent to incineration or landfill.
Stena Recycling collects and treats waste for thousands of B2B customers across the Nordics, so it already holds the data those customers need for E5. Its Customer Portal sells a digital CSRD – ESRS E5 Report service: customers choose locations and a period, and download an audit-ready E5 report in a Basic, Premium or Enterprise tier. The service is live in Sweden, Denmark and Norway, and sits inside a wider “Sustainability Insights” offering alongside CO₂ Impact, Environmental Reporting and the Learning Hub.
Demand was rising fast. Monthly reports from the product team noted “a clear increase in the interest for the ESRS service”: more customer questions through sales, more portal traffic and more purchases at the start of the reporting season. Sales kept seeing the same pattern, conversations that began with waste codes or recycling rates almost always ended in CSRD.
The challenge
The existing service delivered a static report: a list of previously ordered reports and an “Order report” button. It answered “what do I have to submit?” but not “how are we doing, and what should we improve?”
That created three problems:
-
Low perceived value. Data-mature customers exported raw data and built their own Power BI dashboards; smaller customers had no one to do that. Either way, the PDF report itself was rarely used beyond the annual filing — one customer called the aggregated PDF “basically totally useless to us”.
-
Little to upsell. The product owner had committed to a premium tier for CSRD, but there was no clear idea of what extra value customers would pay for.
-
A confusing domain. E5 categories (diverted from disposal, directed to disposal), EU waste codes and R/D treatment codes overlap but are not the same, and customers struggled to connect report headings back to their own waste.
The question we set out to answer: How might we turn CSRD data customers already buy into an ongoing circular performance tool? Is it valuable enough to justify a premium tier, and simple enough for non-experts?
Goals
-
Define premium content grounded in validated customer value, not assumptions.
-
Ship a launch-ready MVP of a “Circular Performance” dashboard (team OKR, June–August 2026).
-
Build it with the existing Customer Portal design system, so it could grow piece by piece.

my responsibility
The concept work was led by a UX Strategist. I joined in January 2026 and worked alongside her through discovery, validation, MVP design and build. I became the day-to-day link between design and the developers, and carried the MVP through implementation over the summer.

Collaborators: UX Strategist, Product Owner (Sustainability Insights), Design System Lead, Platform team developers, local market business owners and sales.
Research & discovery
The interviews showed that every customer valued the same core: a clear picture of where their waste goes, while each wanted a different layer of depth on top. That shaped both the MVP and the premium model.

Three archetypes
Earlier discovery by the UX Strategist produced three archetypes, mindsets rather than job titles, since one person can switch between them depending on the day:


The dashboard concept focused on the performance-oriented mindset, with the report still one click away for compliance needs.
Concept validation interviews
We ran four one-hour remote interviews with Swedish customers from different industries. Each followed the same script so answers could be compared:
-
How they handle CSRD today: tools, workflow, pain points.
-
A walkthrough of the (non-interactive) concept, module by module, with first impressions.
-
A 1–5 value rating per module, then “pick the two you’d keep”.
-
Overall value, likelihood to use, and willingness to pay.


What we learned
-
Everyone liked the Circularity Overview. All interviewees chose it as one of their top two, “that’s really the heart of it all”.
-
Everyone wanted a different second layer. Benchmarks, location ranking, hazardous detail or recommendations mattered to some and not others. One fixed dashboard would never fit all, so customisation became a requirement.
-
Trust comes before visuals. Customers wanted to drill into the articles and codes behind each heading; transparency is what makes the numbers usable.
-
Data alone is not enough. The most valued idea was actionable insight: what to change to improve.
-
Naming matters. One customer warned that calling it “CSRD” would make colleagues assume it only works for the official report. “Circular performance” was easier to understand.
-
Willingness to pay was low in interviews (“it should be part of our contract”), which pushed the team to define premium around depth and customisation rather than the basic overview.
Prioritised needs across all four interviews: (1) traceability, (2) actionable insights, (3) flexible filters and custom KPIs, (4) multi-level comparison by site/region/company, (5) benchmarking, (6) API/Power BI integration, (7) environmental impact quantification, (8) circular performance management rather than compliance only.
Design process
We moved from an unconstrained concept to a validated MVP in about three months, then built it in priority order.

Key decisions
1. One circularity dashboard, with reports as an output. Instead of a separate dashboard for every regulation (CSRD, environmental report, CO₂), the strategy was one view of the company’s waste flows, with the E5 report generated from it. The data is the same; only the reporting format differs.
2. Design the concept free from the library, then map it back. The first concept deliberately ignored existing components to avoid limiting ideas. I then audited it against the Customer Portal library and found most of it could be built from existing parts. Only the circular overview graphic was genuinely new. That made the MVP cheap enough to commit to.
3. Bring developers in early. The concept was shown to the platform team in March, clearly labelled as “not the final colours or charts”, so they could start thinking about data and feasibility in parallel.
4. Ship the most valued piece first. All interviewees chose the Circularity Overview, so it went first. Other modules followed in the order customers ranked them, shown as “coming soon” so the service visibly grew.
5. Simple time filters over a date picker. Year, quarter or month, compared with the previous period or the same period last year. Interviewees confirmed monthly granularity was “plenty”, and fixed periods make comparisons meaningful.
6. Make customisation explicit, but contained. Every customer wanted a different tweak: excluding metals, choosing peers or setting a baseline. We grouped these into one drawer (select articles, own KPIs, target baseline) instead of filters on every card, to keep complexity and maintenance in check.
7. A consistent colour language. Green tones for waste diverted from disposal and red/orange for waste directed to disposal, used in every chart so users learn it once. We softened the palette rather than using the brightest data-viz colours (“too bright doesn’t read as professional”), and centralised the six chart colours in the component library.
The solution
The premium tier adds a Circular Performance dashboard to the E5 report service. It shows where a company’s waste goes and how circular it is, with the official report still one click away.
Circularity Overview (MVP)
-
Top filters for location (following the customer’s own site hierarchy) and period, with comparison to the previous period or year. The filter options were checked in the interviews.
-
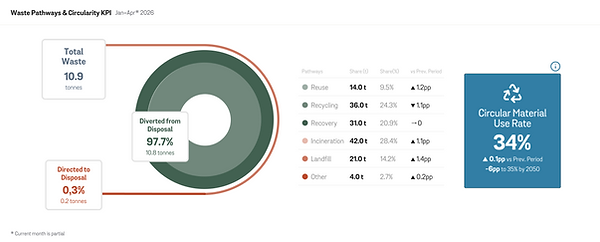
Circularity graphic: concentric rings that split total waste into diverted from disposal (reuse, recycling, other recovery) and directed to disposal (incineration, landfill, other), sized by share.
-
Data table beside the graphic with tonnes, share and change versus the comparison period.
-
KPI card: Circular Material Use Rate, the share of waste that is actually reused or recycled. It follows the EU-level indicator, so it excludes incineration with energy recovery.

Keep small slices visible
Testing with real customer data showed landfill or reuse shares of 0.1–6% almost disappeared in the ring. We set a minimum visual size of 5% per segment, so a small but important red slice is never lost.

If any pathway is smaller of 5% (5px stroke) we will still keep the stroke line as 5px to be able to have a good visibility. In this case it was 0.3% but we leave it as 5%
If any pathway is smaller of 5% (5px stroke) we will still keep the stroke line as 5px to be able to have a good visibility
Added in the next increments
-
Waste Pathway Evolution: stacked bars showing how treatment routes change month by month.
-
Circular Material Use Rate trend, plotted against the customer’s own target.
-
Customise view drawer: choose which articles count (for example, excluding metals), create custom KPIs, set a target baseline, and save views.

Measuring real demand: the premium preview flow
In the interviews, customers valued the dashboard but stated a low willingness to pay. Stated price answers are unreliable, so instead of guessing, we designed a way to measure real demand inside the product. Non-premium users see their Circular Performance dashboard blurred, with a Premium Feature card on top offering three paths:
-
Get Premium: the direct upgrade path
-
Get a trial: for customers who want to try before committing
-
Try sample data dashboard: for customers who want to explore the value without sharing their own data
Separating trial and sample data lets us learn which kind of hesitation customers have, not just whether they want premium. Every click is a signal: clicks and sign-ups on each path tell the team which option to build next.

Designing for every state, not just the happy path
For a compliance tool, a blank or broken screen quickly erodes trust in the numbers. Designing these states together with the developers made sure users always know whether the data is coming, missing, or filtered out.
-
Loading state
A skeleton loader fills the content area while the data is being fetched, so users see the layout of the dashboard immediately. It is replaced as soon as the fetch resolves: to data, to an empty state, or to an error. -
Error state: an extension of loading
With large data sets, a fetch that takes too long is far more common than a hard failure. So instead of a dead-end error page, the skeleton stays in place and a feedback snackbar explains what is happening: the page is loading a large amount of data, and if it doesn’t finish, the user can adjust the filters and try again. This keeps the user oriented and gives them a clear way forward. -
Empty state
When the fetch succeeds but nothing matches the current filters, each module shows “No data to present” with guidance to adjust the filters. This covers both real gaps in the data, such as a location or period with no records, and cases the user created themselves, such as excluding all article types in Customize view.

Around the dashboard
-
State-aware landing page with three versions for a first-time visitor, a Basic buyer and a Premium/Enterprise user: explain, upsell or give quick actions.
-
Pricing & plans redesigned as a three-tier comparison (Basic / Premium / Enterprise), with Premium highlighted and its dashboard features listed.
-
Reporting Guide (previously “About”), rewritten to explain CSRD, the standards and — newly — the methodology and how calculations are made, answering customers’ demand for traceability.
-
Premium preview: non-premium users see a blurred dashboard with Get premium, Request a demo or Register for a trial, so the team could measure demand rather than guess the best conversion strategy.


Outcomes
The MVP went from concept to a working test-environment build that the team described as “very close to the concept”, and was scheduled to launch in all three live markets at the end of September 2026.
-
Built as designed. Filters, circularity graphic, table and KPI card were complete by June. The Waste Pathway Evolution and Circular Material Use Rate graphs, the new landing page and the Reporting Guide followed in August.
-
Research-led scope. Four interviews turned an open-ended “premium version” into a ranked build order. It became the team’s OKR: a launch-ready premium offer with a Circular Performance dashboard “based on validated concept”.
-
Low-cost build. Mapping the concept to existing components meant only one truly new visual component. The six chart colours were added centrally to the component library for reuse.
-
Growing demand for the service. Customer interest, portal traffic and digital report sales grew steadily through the 2026 reporting season, confirming the need for a richer, insight-led offer.
-
A repeatable process. The Figma structure (Discovery → Concept → Validation → MVP exploration → Final design & specs) and the interview template became the plan for the next service, Environmental Reporting.
Reflections
-
Listen for the need behind the question. Customers opened with questions about waste codes or recycling rates, but kept circling back to the same thing: “show me where my waste goes, and let me trust the number”. Traceability turned out to be the foundation; visuals come second.
-
Shared core, personal depth. Four interviews gave four different “second favourites”. Instead of averaging them into one dashboard, we shipped the part everyone valued and made the rest configurable. This also gave the premium tier a clear shape.
-
Interview answers about price need a pinch of salt. People rarely say they’d pay when they know it might cost them. Low stated willingness to pay was a signal to make value obvious, not to stop. It is why we chose to measure real demand through the premium preview.
-
Daily design–dev contact protects quality. Figma looks perfect until real data arrives: a 0.1% landfill slice, a total that doesn’t add up, a title that doesn’t match a component. Reviewing builds with the developer every day, against real customer data, caught these early.
-
Learning a domain fast is a design skill. I started with no background in CSRD, EU waste codes or circularity metrics. Getting fluent enough to question a KPI definition is what made my design decisions credible to sustainability experts.
-
What I’d do next: validate with Danish and Norwegian customers (planned but not yet done when I left), add drill-down from each heading to the articles and codes behind it, and track how often saved views and custom KPIs are actually used.